Quartile Deviation & Mean Deviation: CAIIB ABM Revision
After the standard deviation, the two measures of dispersion CAIIB ABM tests most are the quartile deviation and the mean deviation. They are quick to calculate, they reward a candidate who understands what each one is measuring, and they are exactly the kind of short numerical that lifts your score. This quick revision explains both, works a clean example, and shows when the examiner expects you to reach for the quartile deviation rather than the standard deviation.
Quartile Deviation & Mean Deviation · Watch on YouTube
What the quartile deviation measures
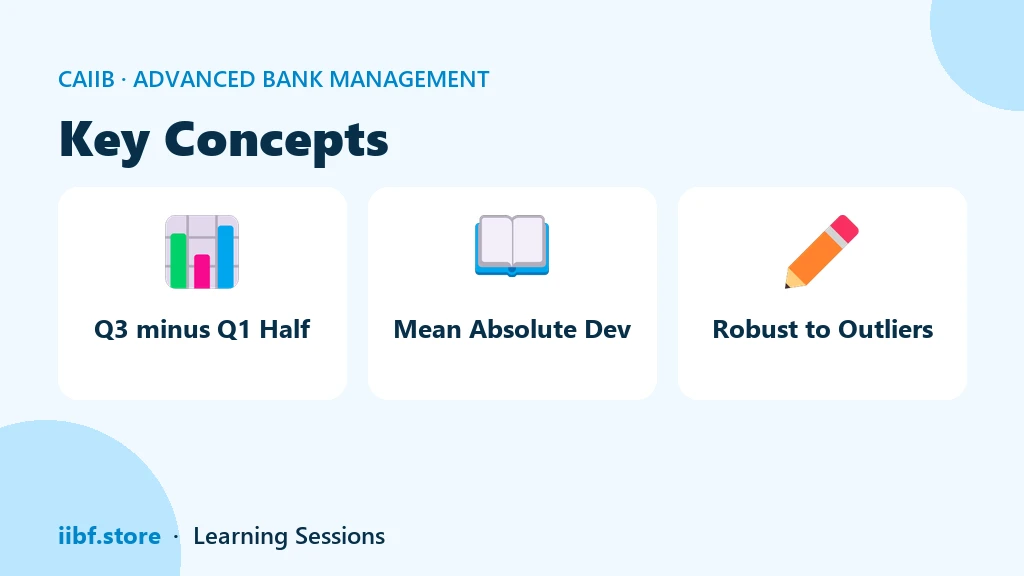
The quartile deviation looks at the middle half of a data set and ignores the extremes. To find it you first locate the first quartile (Q1), the value below which a quarter of the data falls, and the third quartile (Q3), below which three quarters falls. The quartile deviation is half the gap between them. Because it throws away the top and bottom quarters, the quartile deviation is robust to outliers, which is its whole point.
Quartile Deviation = (Q3 − Q1) ÷ 2
Mean deviation, in one line
The mean deviation is the average of the absolute distances of each value from a central point, usually the mean or the median. "Absolute" is the key word: you ignore the plus and minus signs, because otherwise the deviations cancel out to zero. Mean deviation from the median is the smallest possible, a fact examiners like to test directly. The formula is the sum of the absolute deviations divided by the number of items.
Mean Deviation = ∑|x − A| ÷ n, where A is the mean or median
A worked example
Take the ordered data 5, 7, 9, 11, 13. The median is 9. The absolute deviations from 9 are 4, 2, 0, 2, 4, which sum to 12, so the mean deviation is 12 ÷ 5 = 2.4. For the quartile deviation on this small set, Q1 falls at 7 and Q3 at 11, so the quartile deviation is (11 − 7) ÷ 2 = 2. Two different measures of the same spread, each answering a slightly different question.
| Measure | Formula | Result |
|---|---|---|
| Median | middle value | 9 |
| Mean deviation | ∑|x − 9| ÷ 5 | 2.4 |
| Q1 / Q3 | positional | 7 / 11 |
| Quartile deviation | (11 − 7) ÷ 2 | 2 |
When to use which measure
Reach for the quartile deviation when the data has extreme values that would distort the standard deviation, because the quartile deviation quietly ignores them. Use the mean deviation when you want a simple, intuitive average distance that still uses every value. The standard deviation remains the most precise and the most used in further statistics, but it is also the most sensitive to outliers. A CAIIB ABM question that stresses "robust" or "not affected by extreme items" is almost always pointing you to the quartile deviation.
The traps to avoid
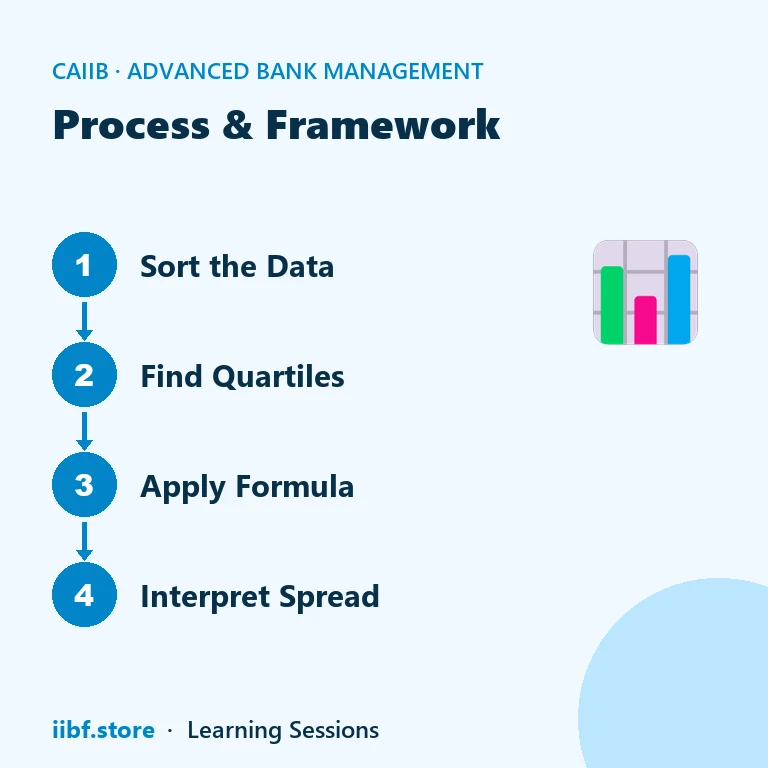
First, forgetting to order the data before locating Q1 and Q3. Second, dropping the absolute-value bars in mean deviation and letting the signs cancel to zero. Third, confusing the quartile deviation with the inter-quartile range, which is Q3 minus Q1 without halving it. Keep these straight and dispersion becomes a reliable scoring block. Practise on our CAIIB test series, revise the full statistics unit in the Advanced Bank Management course, and warm up your recall with a quick round of match games. You can also cross-check the ABM syllabus on the official IIBF website.
Putting the quartile deviation to work
The quartile deviation earns its place in CAIIB ABM because so much banking data is skewed, and skewed data is exactly where the standard deviation misleads. Think of the loan sizes in a branch: a handful of very large accounts sit far above a crowd of small ones. The standard deviation would be dragged upward by those few giants, painting the branch as wildly inconsistent. The quartile deviation ignores the extreme quarter at each end and reports the spread of the typical middle half, giving a far fairer picture of the everyday book. That robustness is the single most important idea to carry into the exam.
The mean deviation sits between the two in spirit. It uses every value like the standard deviation, but it takes plain absolute distances instead of squaring them, so a single outlier influences it less sharply. Because the mean deviation is smallest when measured from the median, examiners often pair a mean-deviation question with a reminder to use the median rather than the mean, and the unwary candidate who defaults to the mean loses an easy mark. Read the central point the question specifies before you start subtracting.
A good habit is to keep a mental hierarchy of the three measures. The quartile deviation is the most resistant to extreme values but uses the least data; the mean deviation uses all the data with moderate resistance to outliers; the standard deviation uses all the data and is the most precise but the most sensitive. When a CAIIB ABM question describes the nature of the data, that description quietly tells you which measure to pick. Match the tool to the data, apply the clean four-step drill, and the quartile deviation and its cousins turn dispersion into one of the friendliest scoring blocks in the paper.
What is the quartile deviation formula?
The quartile deviation equals (Q3 minus Q1) divided by 2. It measures the spread of the middle half of the data and is also called the semi-inter-quartile range.
Why is the quartile deviation robust to outliers?
Because it only uses Q1 and Q3 and ignores the top and bottom quarters of the data, extreme values do not affect it, unlike the standard deviation.
Is mean deviation lowest from the mean or the median?
The mean deviation is smallest when measured from the median. This is a standard property examiners test, so remember to take absolute values from the median for the minimum.
How is the quartile deviation different from the inter-quartile range?
The inter-quartile range is Q3 minus Q1. The quartile deviation is half of that, so quartile deviation equals the inter-quartile range divided by two.
Prefer revising from a printed book?
Chapter-wise books with MCQs after every chapter — minimal pages, complete coverage, delivered anywhere in India. Every book has a free sample to read first.
148 pages · 478 MCQs
Learning Sessions · Ashish Sir
151 pages · 465 MCQs
Learning Sessions · Ashish Sir
148 pages · 375 MCQs
Learning Sessions · Ashish Sir
216 pages · 895 MCQs
Learning Sessions · Ashish Sir
109 pages · 300 MCQs
Learning Sessions · Ashish Sir
104 pages · 360 MCQs
Learning Sessions · Ashish Sir
82 pages · 297 MCQs
Learning Sessions · Ashish Sir
151 pages · 600 MCQs
Learning Sessions · Ashish Sir
98 pages · 282 MCQs
Learning Sessions · Ashish Sir
131 pages · 672 MCQs
Learning Sessions · Ashish Sir
221 pages · 831 MCQs
Learning Sessions · Ashish Sir
128 pages · 524 MCQs
Learning Sessions · Ashish Sir
107 pages · 445 MCQs
Learning Sessions · Ashish Sir
132 pages · 225 MCQs
Learning Sessions · Ashish Sir
188 pages · 435 MCQs
Learning Sessions · Ashish Sir
117 pages · 236 MCQs
Learning Sessions · Ashish Sir
Learning Sessions · Ashish Sir
118 pages · 299 MCQs
Learning Sessions · Ashish Sir
Learning Sessions · Ashish Sir
Learning Sessions · Ashish Sir
Learning Sessions · Ashish Sir
115 pages · 255 MCQs
Learning Sessions · Ashish Sir
Learning Sessions · Ashish Sir
334 pages · 936 MCQs
Learning Sessions · Ashish Sir
Learning Sessions · Ashish Sir
115 pages · 344 MCQs
Learning Sessions · Ashish Sir
107 pages · 240 MCQs
Learning Sessions · Ashish Sir
90 pages · 150 MCQs
Learning Sessions · Ashish Sir
Learning Sessions · Ashish Sir
Quick quiz on this topic
5 exam-style questions from our free test bank — check yourself before you move on.
Practice this topic
Take a free mock test, download chapter PDFs, or watch a video class — all included on iibf.store.