Reading Bank Financial Statements: Ratio Analysis for Bankers

Reading Bank Financial Statements is a core skill for every banker and a high-value topic in JAIIB Accounting and Financial Management for Bankers (AFM). Unlike an ordinary company. A bank's accounts follow a special format prescribed under the Banking Regulation Act, 1949, and ratio analysis is the key to interpreting them. This guide explains how to read bank financial statements — the balance sheet. The profit and loss account and the schedules — and how to use ratios and key indicators to judge a bank's profitability, asset quality and capital strength.
The Structure of Bank Financial Statements
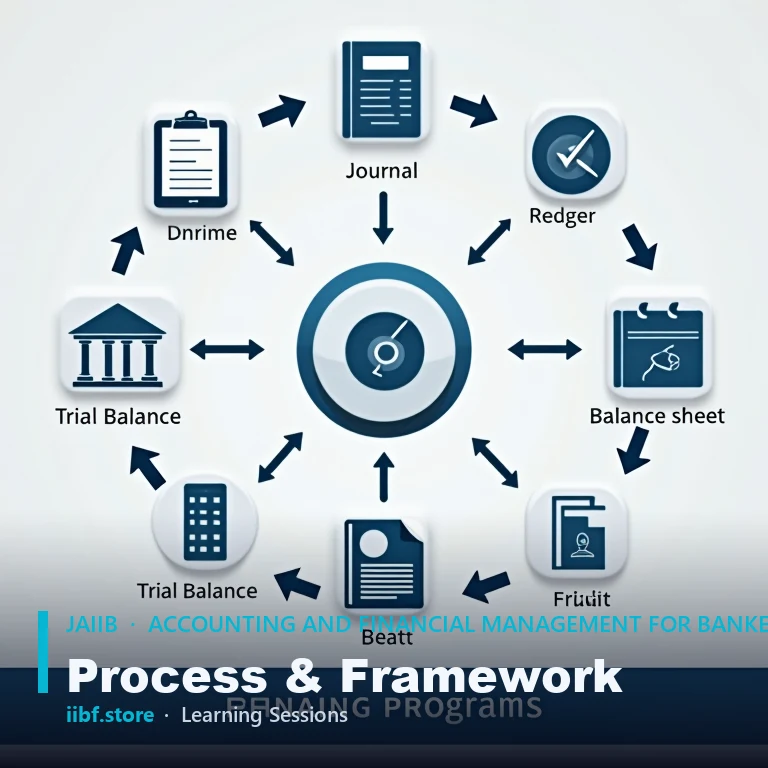
Indian banks present their accounts in the formats laid down in the Third Schedule to the Banking Regulation Act. 1949, supplemented by RBI guidelines and Indian Accounting Standards (Ind AS) where applicable. The two principal bank financial statements are the Balance Sheet (Form A) and the Profit and Loss Account (Form B), each supported by detailed schedules.
On the balance sheet, the liabilities side carries capital, reserves and surplus, deposits, borrowings and other liabilities, while the assets side shows cash and balances with the RBI, balances with banks, investments, advances and fixed assets. The profit and loss account splits income into interest earned and other income, and expenditure into interest expended, operating expenses and provisions. Eighteen schedules break these heads down further. Understanding this layout is the first step before any ratio work, and the JAIIB course covers each schedule in detail.
The Profit and Loss Account and Profitability Ratios
Profitability tells you whether a bank earns enough from its core business of lending and investing. The most important profitability metric drawn from bank financial statements is the Net Interest Margin (NIM) — the difference between interest earned and interest expended. Expressed as a percentage of average interest-earning assets. A healthy NIM signals efficient spread management.
Other key profitability indicators include:
- Return on Assets (ROA): net profit divided by average total assets — measures how efficiently assets generate profit.
- Return on Equity (ROE): net profit divided by net worth — the return to shareholders.
- Cost-to-Income Ratio: operating expenses divided by net total income — lower is better and reflects operational efficiency.
- Non-Interest Income Ratio: fee, commission and treasury income as a share of total income.
Together these reveal whether profits come from sustainable spreads or one-off gains. You can practise computing them with worked numericals on the IIBF mock tests, which mirror the AFM exam style.

Asset Quality and Capital Adequacy Indicators
Profit means little if the loan book is rotting, so asset quality ratios from bank financial statements are critical. The headline figures are Gross Non-Performing Assets (GNPA) ratio and Net NPA ratio. A loan is classified NPA when interest or principal is overdue for more than 90 days. Net NPA deducts provisions; the gap between gross and net reflects the Provision Coverage Ratio (PCR) — higher coverage means the bank has set aside more against bad loans.
Capital adequacy measures the bank's cushion to absorb losses. Under Basel III, banks maintain a minimum Capital to Risk-weighted Assets Ratio (CRAR), supplemented by a Capital Conservation Buffer. Indian regulations require a CRAR generally higher than the 8% Basel minimum, alongside minimum Common Equity Tier 1 (CET1) requirements.
| Indicator | What it measures |
|---|---|
| GNPA / Net NPA | Share of bad loans in the portfolio |
| Provision Coverage Ratio | Provisions held against NPAs |
| CRAR (Basel III) | Capital cushion vs risk-weighted assets |
| Credit-Deposit Ratio | Advances funded by deposits |
You can cross-check current prudential norms on the Reserve Bank of India website and current rates on the RBI rates page.
Liquidity, Efficiency and Putting Ratios Together
Liquidity ratios confirm a bank can meet obligations as they fall due. The Credit-Deposit (CD) ratio shows how much of deposits is deployed as advances. Basel III adds the Liquidity Coverage Ratio (LCR) and Net Stable Funding Ratio (NSFR), which ensure banks hold enough high-quality liquid assets and stable funding. Statutory ratios — the CRR and SLR — also constrain how funds are deployed.
The real skill in reading bank financial statements is combining ratios into a coherent picture: strong NIM and ROA, low GNPA with high provision coverage, comfortable CRAR, and a balanced CD ratio together describe a sound, well-run bank. A single ratio in isolation can mislead, so analysts read trends over several years and compare peers. Build this analytical habit, and questions in AFM become straightforward. Explore more worked examples on the iibf.store blog.

A Worked Example: Reading Ratios Together
Imagine two banks with identical net profit. Bank X reports a net interest margin of 3.2%. A gross NPA ratio of 2.1% with provision coverage of 75%, a capital ratio comfortably above the regulatory minimum, and a cost-to-income ratio of 45%.
Bank Y reports the same profit but with a thinner margin of 2.1%. A gross NPA ratio of 6.5% with provision coverage of only 50%, capital barely above the minimum, and a cost-to-income ratio of 60%. The profit figure alone hides everything that matters.
Reading the ratios as a set reveals that Bank X earns sustainably from healthy spreads. Runs a clean loan book with adequate cushions, and operates efficiently, whereas Bank Y is masking deteriorating asset quality and weak buffers behind a flattering bottom line. An analyst would also examine trends over three to five years and benchmark both against peers.
Because a single year can be distorted by one-off treasury gains or tax write-backs. This is precisely the kind of comparative interpretation the AFM examiner rewards: not just computing a ratio. But explaining what the combination signals about a bank's financial health and resilience.
Why This Matters for JAIIB AFM Candidates
The AFM paper regularly asks candidates to interpret extracts of bank financial statements. Compute NIM, ROA, CRAR or NPA ratios, and identify what each indicator signals about a bank's health. Beyond the exam, credit officers, branch managers and analysts use exactly these tools to appraise borrowers and assess their own institution. Memorise the formats and formulas, practise numericals under time pressure, and learn to read the story the numbers tell rather than the numbers alone.
Which two statements make up a bank's financial statements?
The two principal statements are the Balance Sheet (Form A) and the Profit and Loss Account (Form B). Presented in the formats prescribed under the Third Schedule to the Banking Regulation Act, 1949, with eighteen supporting schedules.
What is Net Interest Margin (NIM)?
NIM is the difference between interest earned and interest expended, expressed as a percentage of average interest-earning assets. It measures how efficiently a bank manages the spread between its lending and funding rates and is a key profitability indicator.
When is a loan classified as a Non-Performing Asset?
A term loan generally becomes an NPA when interest or principal remains overdue for more than 90 days. The Gross NPA and Net NPA ratios, along with the Provision Coverage Ratio, summarise a bank's asset quality.
What is CRAR under Basel III?
The Capital to Risk-weighted Assets Ratio (CRAR) measures a bank's capital against its risk-weighted assets. Under Basel III, Indian banks must maintain a minimum CRAR plus a Capital Conservation Buffer and minimum CET1 capital, ensuring a cushion to absorb losses.
Conclusion
Confidently reading bank financial statements through ratio analysis is one of the most rewarding skills in JAIIB AFM and in your banking career. Learn the formats, master the profitability, asset-quality, capital and liquidity ratios, and practise interpreting them as a set. Ready to apply it? Attempt a free JAIIB AFM mock test on iibf.store or join the complete JAIIB preparation course to score 100.
Quick quiz on this topic
5 exam-style questions from our free test bank — check yourself before you move on.
Practice this topic
Take a free mock test, download chapter PDFs, or watch a video class — all included on iibf.store.
Keep reading