
Operational Risk Capital: Basel III Standardised Approach

For years, operational risk was the soft corner of Basel. Credit risk had ratings and risk weights, market risk had VaR, and operational risk had a shrug and a percentage of gross income. That era is over. The Basel III framework replaced every legacy method with one operational risk capital calculation, and the Reserve Bank has already written it into Indian regulation. If you are sitting CAIIB BFM, this is one of the likeliest places for a new-syllabus question.
Ashish Sir's short lays out the update in a minute. Watch it, then work through the mechanics below, because this topic is arithmetic before it is theory.
Basel 3 - operational risk capital update #caiib · Watch on YouTube
What actually changed
The instrument is the Reserve Bank of India (Minimum Capital Requirements for Operational Risk) Directions, 2023, issued on 26 June 2023. Its effect is simple to state and easy to under-appreciate: the Basic Indicator Approach, the Standardised Approach, the Alternative Standardised Approach and the Advanced Measurement Approach are all replaced by a single new Standardised Approach. Not narrowed. Replaced.
One nuance separates a careful candidate from a careless one. The Directions have been issued, but the Reserve Bank stated that the effective date would be communicated separately, and until then banks continue with the existing approaches under the Master Circular on Basel III Capital Regulations. So if a question asks what a bank computes today as against what the Directions prescribe, those can be two different answers. Read the stem carefully.
Scope also matters. The Directions apply to commercial banks, but Local Area Banks, Payments Banks, Regional Rural Banks and Small Finance Banks are outside their ambit. That exclusion list is a ready-made multiple choice question.
The Business Indicator: a financial-statement proxy
The old AMA let a large bank build its own internal model. Supervisors across jurisdictions found the results were not comparable between banks and, awkwardly, tended to fall over exactly when a bank was in trouble. The new approach abandons internal modelling for a formula anyone can audit off published accounts.
The starting point is the Business Indicator, a proxy for how much operational risk a bank's sheer volume of business generates:
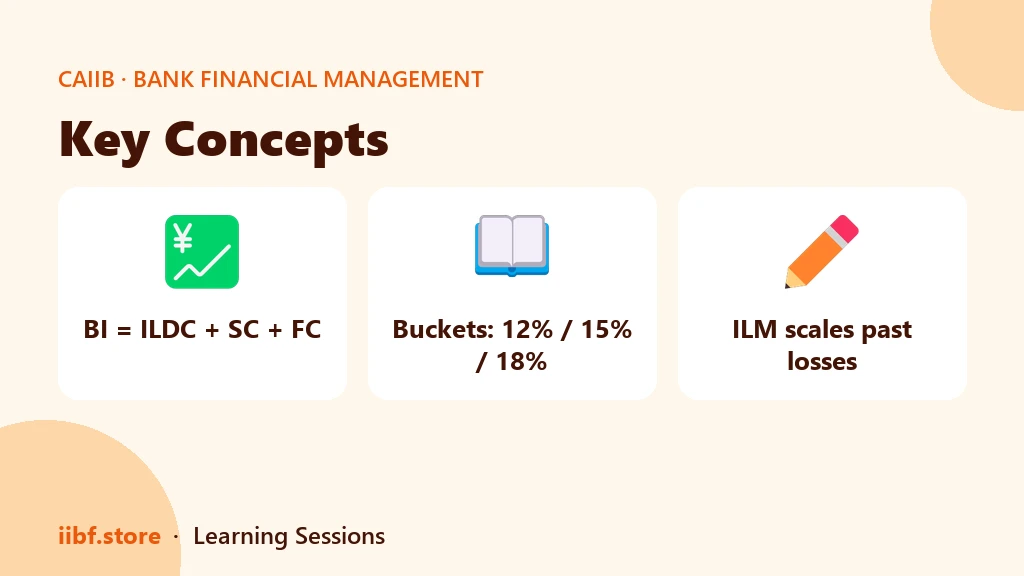
BI = ILDC + SC + FC
- ILDC, the Interest, Lease and Dividend Component, captures the banking book: net interest income, lease income and dividend income.
- SC, the Services Component, captures fee and commission income and expense plus other operating income and expense.
- FC, the Financial Component, captures net profit or loss on the trading book and on the banking book.
Each component is a three-year average, which stops one freak year from swinging the requirement. Note also that the components use absolute values in several places, so a loss does not conveniently reduce your operational risk capital charge. Bigger balance sheet, bigger BI, bigger charge, regardless of whether the year was good or bad.
From BI to BIC: the marginal coefficients
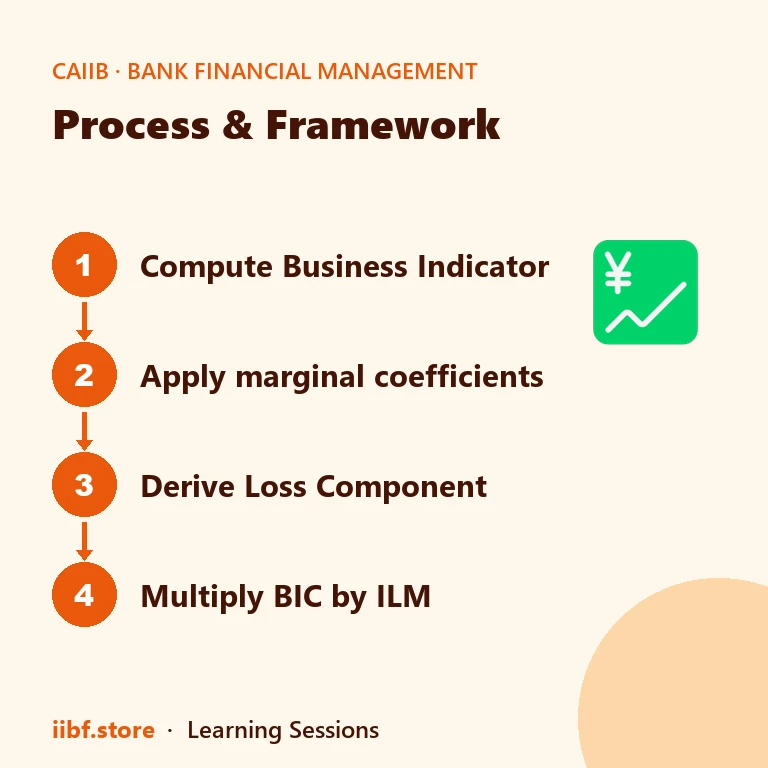
The Business Indicator is then converted into the Business Indicator Component by applying marginal coefficients across three buckets. Marginal is the operative word: like income tax slabs, each tranche of BI attracts the coefficient of its own bucket, not one flat rate on the whole amount.
| Bucket | BI range | Marginal coefficient | ILM applied? |
|---|---|---|---|
| 1 | Up to Rs 8,000 crore | 12% | No |
| 2 | Above Rs 8,000 crore up to Rs 2,40,000 crore | 15% | Yes |
| 3 | Above Rs 2,40,000 crore | 18% | Yes |
Work an example. A bank with a BI of Rs 20,000 crore does not compute 15% of 20,000. It computes 12% on the first Rs 8,000 crore, which is Rs 960 crore, plus 15% on the remaining Rs 12,000 crore, which is Rs 1,800 crore. Its BIC is Rs 2,760 crore. Calculate it as a flat 15% and you get Rs 3,000 crore, and you have lost the mark.
The Internal Loss Multiplier: where your own history bites
The BIC alone is a size measure. Two banks with identical balance sheets can have very different operational risk records, and the framework accounts for that through the Internal Loss Multiplier, a scaling factor built from a bank's own loss experience relative to its BIC.
The Loss Component is defined as fifteen times a bank's average annual operational risk losses. The ILM then compares that Loss Component with the BIC. The consequence is intuitive: a bank whose historical losses are broadly in line with what its size implies gets a multiplier near one; a bank with a worse-than-implied loss record gets a multiplier above one and pays more capital; a genuinely clean record pulls the multiplier below one and earns relief.
Data quality is the gate. Banks are expected to use ten years of high-quality loss data, and a bank with at least five years may use the loss data it has. Bucket 1 banks apply the BIC alone without the ILM adjustment, a deliberate proportionality concession to smaller institutions. This is the piece that turns loss data collection from a back-office chore into a capital-saving discipline, and it is why supervisory expectations on loss event capture and event-type classification suddenly carry a price tag.
Why the regulator made this change
Three reasons are worth carrying into an interview or a descriptive answer. Comparability: two banks of similar size now produce broadly similar numbers, and an analyst can reconstruct the calculation from public accounts. Simplicity: one method for everyone removes the incentive to shop for the approach that yields the lowest charge. Incentive alignment: because the ILM rewards a better loss record, capital relief now flows from fixing your control environment rather than from refining a model.
The trade-off is real and you should be able to name it. A formula driven by income statement size is blunt. A bank can shrink its charge by shrinking its fee business, which says nothing about whether its controls are sound. The framework accepts that bluntness in exchange for comparability, and Pillar 2 is where a supervisor is expected to pick up what the formula misses.
Exam angle
Expect three shapes. A marginal-coefficient computation exactly like the Rs 20,000 crore example. A definitional question on what BI, BIC, LC or ILM stands for, or on the exclusion list. And a conceptual question on why AMA was withdrawn. Drill all three in our CAIIB test series; the topic sits in CAIIB Bank Financial Management, and the risk chapters in Advanced Bank Management give you the surrounding context. Map the revision into your study planner and watch the blog for the effective-date notification when it lands. The Directions themselves are on rbi.org.in and are worth one slow read.
A final framing that helps the concept stick. Under the old regime, a bank could reduce its operational risk capital by improving its model. Under the new one, the only lever it has left is to actually lose less money. That is the whole point of the reform in a single sentence.
Which approaches does the new Standardised Approach replace?
All of them: the Basic Indicator Approach, the Standardised Approach, the Alternative Standardised Approach and the Advanced Measurement Approach are replaced by the single Basel III Standardised Approach.
Are the coefficients applied marginally or as a flat rate?
Marginally, like tax slabs. Each tranche of the Business Indicator attracts its own bucket's coefficient of 12%, 15% or 18%, not a single rate on the whole amount.
Which banks are outside the scope of these Directions?
Local Area Banks, Payments Banks, Regional Rural Banks and Small Finance Banks are excluded from the ambit of the 2023 Directions.
Do Bucket 1 banks apply the Internal Loss Multiplier?
No. Bucket 1 banks use the Business Indicator Component alone. The ILM applies to banks in Buckets 2 and 3, subject to their having adequate high-quality loss data.
Quick quiz on this topic
5 exam-style questions from our free test bank — check yourself before you move on.
Practice this topic
Take a free mock test, download chapter PDFs, or watch a video class — all included on iibf.store.
Keep reading



