Kurtosis Explained Simply: CAIIB ABM Quick Revision 2026
The word kurtosis sounds like something out of a medical textbook, and that alone scares plenty of CAIIB candidates into skipping it. That is a mistake. Kurtosis is one of the easiest one-mark concepts in the CAIIB ABM statistics chapter once you stop memorising the Greek and start picturing the shape of a curve. In the next few minutes you will understand what kurtosis measures, the three types you must recognise, and the exact way IIBF frames the question.
Start with the quick video below — it explains kurtosis in plain language — and then use the written notes to make the idea stick.
Kurtosis Explained Simply · CAIIB ABM Quick Revision · Watch on YouTube
What is kurtosis, really?
Kurtosis measures the peakedness of a distribution — how sharp or flat the top of the curve is, and how heavy its tails are. Where standard deviation tells you how spread out the data is, this measure tells you how that spread is arranged around the centre. A dataset can have the same mean and the same standard deviation as another and still look completely different in shape, and this statistic is the number that captures that difference.
In banking terms, it matters for risk. A returns distribution with a high value has fat tails, meaning extreme gains and extreme losses happen more often than a normal bell curve would predict. That is precisely why examiners tuck this topic into the ABM risk-and-statistics questions.

The three types of kurtosis you must know
Every question on this topic tests whether you can match a description to one of three shapes. The benchmark is the normal distribution, which has a kurtosis value of 3 (or an excess kurtosis of 0).
| Type | Shape | Kurtosis value | Excess kurtosis |
|---|---|---|---|
| Leptokurtic | Tall, sharp peak, fat tails | Greater than 3 | Positive |
| Mesokurtic | Normal bell curve | Equal to 3 | Zero |
| Platykurtic | Flat top, thin tails | Less than 3 | Negative |
A simple memory hook: Lepto = leaping up (tall), Platy = plateau (flat), Meso = middle (normal). Get those three anchors right and you will never miss one of these questions again.
How kurtosis is calculated
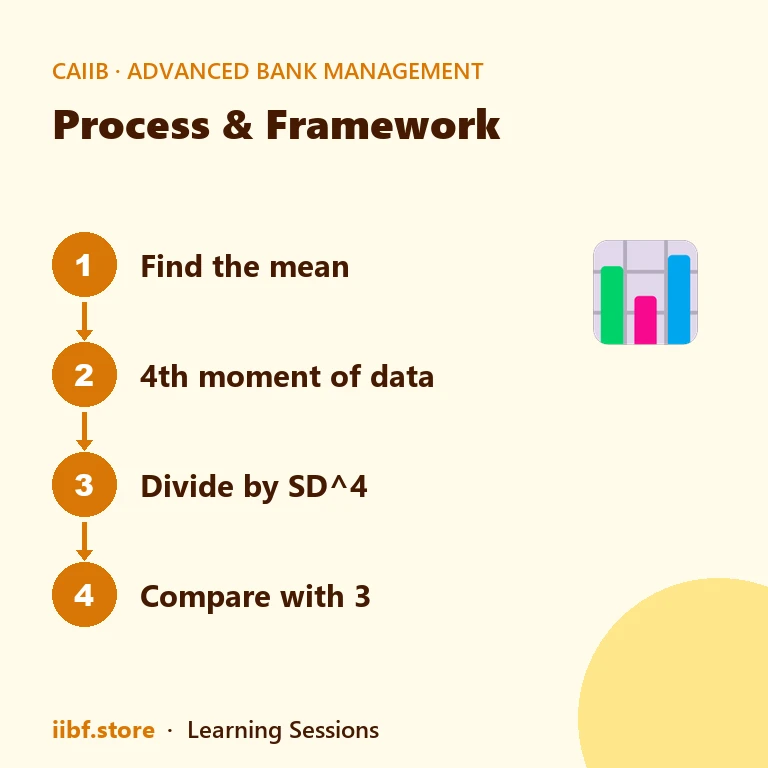
You are rarely asked to compute kurtosis by hand in the exam, but knowing the structure of the formula helps you reason about the options. Kurtosis is based on the fourth moment of the data about the mean:
Kurtosis = [ Σ(x − mean)⁴ ÷ n ] ÷ SD⁴
Read it as: take each deviation from the mean, raise it to the fourth power, average those, then divide by the standard deviation raised to the fourth power. Because deviations are raised to the fourth power, extreme values dominate the result — which is exactly why the measure is so sensitive to fat tails. Subtract 3 from this figure and you get excess kurtosis, the version many textbooks quote.
Kurtosis versus skewness — do not confuse them
Both kurtosis and skewness describe the shape of a distribution, and the exam loves to test whether you can tell them apart. Skewness is about symmetry — whether the curve leans left or right. Kurtosis is about peakedness and tails — how tall and heavy-tailed the curve is. A distribution can be perfectly symmetrical (zero skewness) and still be sharply peaked (high kurtosis). Keep the two ideas in separate mental boxes and the trap options fall away.
To drill these shape concepts, run through our CAIIB practice tests, reinforce the definitions with the statistics match game, and study the full theory inside the Advanced Bank Management course. For the formal definition, the Indian Institute of Banking & Finance follows the standard statistical treatment described above.
Why the shape of the tails matters to a bank
It is easy to dismiss this concept as abstract statistics, but the peakedness of a distribution has a very concrete meaning for a lender. When a bank models the returns on a portfolio, or the losses on a book of loans, it wants to know how often extreme outcomes will strike. A distribution with heavy tails warns that big surprises — both good and bad — are more likely than a gentle bell curve would suggest. Ignore that warning and you understate your risk.
This is why risk managers care so much about the tails. Two loan books can share an identical average default rate and an identical standard deviation, yet one may hide a cluster of rare, catastrophic losses that the other does not. The measure of peakedness is what separates them. A leptokurtic loss distribution signals fat tails and a higher chance of an outlier event, which is exactly the sort of scenario that stress tests are built to expose.
The Advanced Bank Management paper rewards candidates who connect the statistic to this practical judgment rather than treating it as a formula to memorise. So when you meet a shape question in the exam, do not just recall the definition — picture the curve, picture the tails, and ask what it would mean for a portfolio. That mental image makes the correct option obvious and gives you a story you can carry into the risk-management modules later in the syllabus. Kurtosis, in short, is the language a bank uses to talk about how bad a bad day can get.
Frequently asked questions
What does a high kurtosis value mean?
A high kurtosis (greater than 3, or leptokurtic) means the distribution has a sharp central peak and fat tails, so extreme values occur more often than in a normal distribution. In risk terms, it signals a higher chance of outlier gains or losses.
Is the normal distribution leptokurtic or mesokurtic?
The normal distribution is mesokurtic. Its kurtosis value is exactly 3, giving an excess kurtosis of zero. It is the benchmark against which leptokurtic and platykurtic shapes are compared.
What is the difference between kurtosis and skewness?
Skewness measures how asymmetrical a distribution is — whether it leans left or right. Kurtosis measures how peaked it is and how heavy its tails are. They describe two independent features of the same curve.
Will kurtosis be asked in CAIIB ABM 2026?
Yes, kurtosis is part of the statistics module of the Advanced Bank Management syllabus and appears regularly, usually as a one-mark conceptual MCQ asking you to identify the type of distribution.
Prefer revising from a printed book?
Chapter-wise books with MCQs after every chapter — minimal pages, complete coverage, delivered anywhere in India. Every book has a free sample to read first.
148 pages · 478 MCQs
Learning Sessions · Ashish Sir
151 pages · 465 MCQs
Learning Sessions · Ashish Sir
148 pages · 375 MCQs
Learning Sessions · Ashish Sir
216 pages · 895 MCQs
Learning Sessions · Ashish Sir
109 pages · 300 MCQs
Learning Sessions · Ashish Sir
104 pages · 360 MCQs
Learning Sessions · Ashish Sir
82 pages · 297 MCQs
Learning Sessions · Ashish Sir
151 pages · 600 MCQs
Learning Sessions · Ashish Sir
98 pages · 282 MCQs
Learning Sessions · Ashish Sir
131 pages · 672 MCQs
Learning Sessions · Ashish Sir
221 pages · 831 MCQs
Learning Sessions · Ashish Sir
128 pages · 524 MCQs
Learning Sessions · Ashish Sir
107 pages · 445 MCQs
Learning Sessions · Ashish Sir
132 pages · 225 MCQs
Learning Sessions · Ashish Sir
188 pages · 435 MCQs
Learning Sessions · Ashish Sir
117 pages · 236 MCQs
Learning Sessions · Ashish Sir
Learning Sessions · Ashish Sir
118 pages · 299 MCQs
Learning Sessions · Ashish Sir
Learning Sessions · Ashish Sir
Learning Sessions · Ashish Sir
Learning Sessions · Ashish Sir
115 pages · 255 MCQs
Learning Sessions · Ashish Sir
Learning Sessions · Ashish Sir
334 pages · 936 MCQs
Learning Sessions · Ashish Sir
Learning Sessions · Ashish Sir
115 pages · 344 MCQs
Learning Sessions · Ashish Sir
107 pages · 240 MCQs
Learning Sessions · Ashish Sir
90 pages · 150 MCQs
Learning Sessions · Ashish Sir
Learning Sessions · Ashish Sir
Quick quiz on this topic
5 exam-style questions from our free test bank — check yourself before you move on.
Practice this topic
Take a free mock test, download chapter PDFs, or watch a video class — all included on iibf.store.