
Leverage and Capital Structure Guide for CAIIB ABFM 2026
Every CAIIB ABFM candidate eventually runs into the same wall: how much debt should a firm carry, and what does that do to shareholder returns? That is precisely what leverage and capital structure analysis answers. Bankers use it to judge a borrower's repayment cushion; finance managers use it to pick the debt-equity mix that maximises value without inviting default risk. This guide breaks the topic into exam-ready pieces — formulas, theories and a practice set.
📊 What Is Capital Structure and Why It Matters for Banks
Capital structure is the proportion of debt and equity a firm uses to fund its assets. For a bank credit officer, the debt-equity ratio embedded in a borrower's capital structure signals how much business risk is already absorbed by owners versus lenders. A firm loaded with debt pays fixed interest regardless of how sales perform, magnifying the swings in returns to equity holders — good in a boom, painful in a slowdown. CAIIB ABFM expects you to connect this to real credit decisions: term-loan appraisal, covenant design and rating outcomes trace back to capital structure choices. The management functions of Planning and Controlling from your syllabus are directly relevant — a firm plans its financing mix, then controls deviations through budgets and covenant monitoring.
💡 Exam Tip: If a question mentions "fixed operating costs," think operating leverage. If it mentions "fixed interest/preference dividend," think financial leverage. Keep the two triggers separate.
⚙️ Operating, Financial and Combined Leverage Explained
Leverage measures how a fixed cost amplifies the effect of a sales change on profit. Operating leverage arises from fixed operating costs (rent, depreciation, salaries), measured by the Degree of Operating Leverage (DOL) — % change in EBIT for a given % change in sales. Financial leverage arises from fixed financing costs (interest, preference dividend), measured by the Degree of Financial Leverage (DFL) — % change in EPS for a given % change in EBIT. Multiply the two for the Degree of Combined Leverage (DCL), showing how a small sales change cascades down to EPS. A firm with high operating leverage that also takes on high financial leverage is doubly exposed — a modest sales dip can crush EPS, and banks price this combined risk into the interest rate and covenant package they offer.
| Leverage Type | Formula | What It Measures | Directly Moves EPS? |
|---|---|---|---|
| Operating Leverage (DOL) | % Δ EBIT ÷ % Δ Sales | Business/operating risk | ❌ |
| Financial Leverage (DFL) | % Δ EPS ÷ % Δ EBIT | Financial risk from debt/pref. capital | ✅ |
| Combined Leverage (DCL) | DOL × DFL | Total risk (sales to EPS) | ✅ |

🏦 EBIT-EPS Analysis and the Indifference Point
EBIT-EPS analysis is the practical tool finance managers use to choose between financing alternatives — say, an all-equity issue versus a debt-heavy issue — at different levels of expected EBIT. The financial break-even point is the EBIT at which EPS is exactly zero, while the indifference point (or crossover point) is the EBIT level at which two financing plans produce identical EPS. Below the indifference point, the plan with lower fixed financial costs (more equity) gives a higher EPS; above it, the more leveraged plan wins because fixed interest is already covered and every extra rupee of EBIT flows to a smaller equity base. CAIIB numericals typically give two financing plans and ask you to compute this crossover EBIT algebraically, then pick the plan suited to the firm's forecast and risk appetite. This is a close cousin of the valuation logic covered in discounted cash flow valuation, since both discount future earnings under different capital structures.
⚠️ Common Mistake: Students often forget to adjust preference dividend for tax when comparing plans — preference dividend is paid out of post-tax profit, unlike interest, which is tax-deductible. Missing this flips the indifference-point answer.
🧮 Capital Structure Theories: NI, NOI, MM and Trade-off
Four theories anchor this chapter. The Net Income (NI) approach says more debt always lowers the overall cost of capital and raises firm value, since debt is cheaper than equity. The Net Operating Income (NOI) approach argues the opposite — cost of capital stays constant regardless of mix, because a drop in the cost of debt is offset by a rise in the cost of equity, so structure is irrelevant to value. Modigliani-Miller (MM), in their original no-tax world, agreed with NOI. Once MM added corporate taxes, they reversed course — the interest tax shield makes debt valuable, so value rises with leverage, until distress costs bite. Trade-off theory then balances that tax shield against rising distress and agency costs, landing on an optimal structure somewhere in the middle. Related valuation concepts — including the comparable-multiples approach covered under business valuation methods every banker should know — build on the same cost-of-capital foundations.
🛡️ Optimal Capital Structure and Risk-Return Trade-off for CAIIB
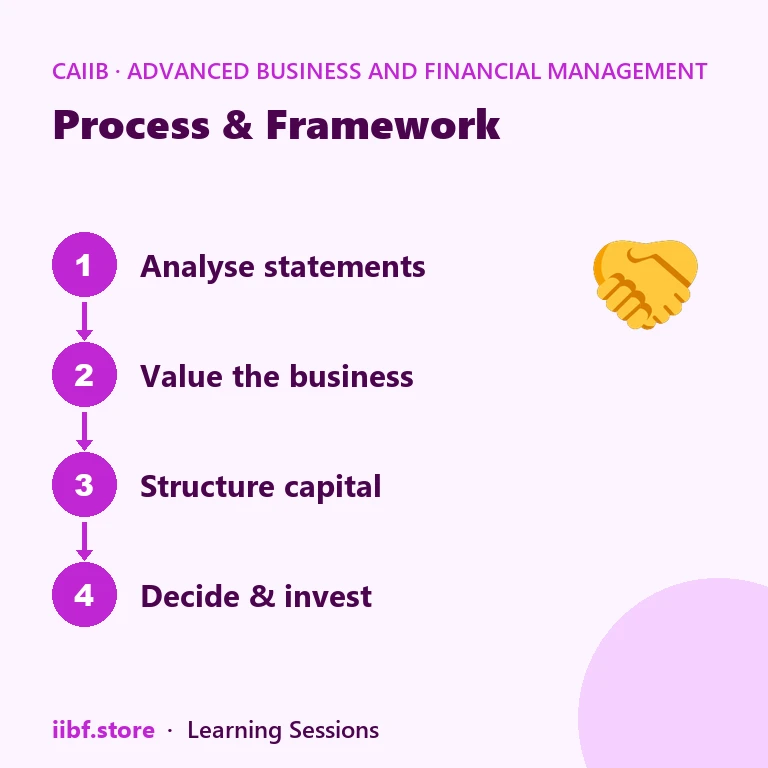
In practice, no firm hunts for the mathematically "optimal" capital structure — it aims for a comfortable range that keeps WACC low while preserving flexibility and an acceptable credit rating. Bankers appraising a proposal check debt-equity ratio, interest coverage ratio (ICR) and DSCR alongside DOL/DFL to judge whether the structure leaves enough cushion for a sales downturn. A firm that recently completed a large acquisition — the scenario in mergers and acquisitions — CAIIB ABFM 2026 guide — often carries elevated post-deal leverage, and lenders stress-test it before extending fresh facilities. Even banks face this: they must hold a minimum leverage ratio under the Basel III framework prescribed by the RBI's Basel III capital regulations — a reminder that "more leverage means more value" is not universally true. For CAIIB, remember the sequence: identify fixed costs, compute DOL/DFL/DCL, run EBIT-EPS for the indifference point, then judge the mix against trade-off theory limits.
📌 Remember: Higher leverage lowers WACC only up to the point where distress-cost and agency-cost increases start to outweigh the tax shield — beyond that, more debt destroys value, not creates it.
The basic of management and basics of management chapters set up the planning-control cycle these decisions run through, so revise them alongside this topic. Also covering CAIIB's technology paper? The API banking in India guide is a useful cross-subject refresher.

🧠 Practice MCQs: Leverage and Capital Structure
Q1. A firm's DOL is 2 and DFL is 1.5. What is its Degree of Combined Leverage (DCL)? (a) 0.75 (b) 3.0 (c) 3.5 (d) 2.5
Answer: (b) — DCL = DOL × DFL = 2 × 1.5 = 3.0.
Q2. Which theory holds that the overall cost of capital is unaffected by the debt-equity mix under perfect market conditions? (a) Net Income approach (b) Trade-off theory (c) Net Operating Income / MM (no-tax) approach (d) Pecking order theory
Answer: (c) — The NOI approach and the original (no-tax) Modigliani-Miller proposition both treat capital structure as irrelevant to firm value.
Q3. At the EBIT-EPS indifference point between two financing plans: (a) EPS is always zero (b) Both plans give the same EPS (c) The more leveraged plan always gives higher EPS (d) Only the equity plan is viable
Answer: (b) — The indifference (crossover) point is the EBIT level at which both financing alternatives yield identical EPS.
Q4. Under trade-off theory, firm value from added debt eventually falls because of: (a) Falling tax rates (b) Rising cost of financial distress and agency costs (c) Falling interest rates (d) Increasing depreciation
Answer: (b) — Beyond an optimal point, expected distress and agency costs outweigh the interest tax shield, reducing firm value.
Q5. A high Degree of Operating Leverage (DOL) indicates the firm has: (a) High fixed operating costs relative to variable costs (b) High debt relative to equity (c) Low business risk (d) No fixed costs
Answer: (a) — DOL rises with the proportion of fixed operating costs, which magnifies EBIT swings for a given change in sales.
Want chapter-wise mock tests with 100+ MCQs? Start practising free →
What is the difference between operating leverage and financial leverage?
Operating leverage comes from fixed operating costs and links sales changes to EBIT changes; financial leverage comes from fixed financing costs (interest, preference dividend) and links EBIT changes to EPS changes.
What is the EBIT-EPS indifference point used for?
It identifies the EBIT level at which two financing plans produce the same EPS, helping a firm decide which financing mix is better above or below that EBIT level.
Does more debt always increase firm value?
No. Under trade-off theory, debt raises value only up to the point where the interest tax shield is offset by rising expected costs of financial distress and agency conflicts.
Why does capital structure matter for CAIIB ABFM candidates?
It links directly to credit appraisal, EBIT-EPS numericals, and theory-based questions on NI, NOI, MM and trade-off approaches — a recurring high-weightage area in the exam.
Ready to lock this in? Revise the formulas above, browse more ABFM study articles, then test yourself with a full CAIIB course mock or jump into chapter-wise practice tests.
Quick quiz on this topic
5 exam-style questions from our free test bank — check yourself before you move on.
Practice this topic
Take a free mock test, download chapter PDFs, or watch a video class — all included on iibf.store.
Keep reading



