Scenario Analysis in Operational Risk: Building Tail Loss Estimates (IIBF RM)
For IIBF Risk Management candidates, scenario analysis in operational risk is the tool examiners expect you to know cold, because loss data alone cannot see what has not yet happened to your bank. A branch has never lost fifty crore to a single rogue-trader event, so does history say that risk does not exist? No. Basel's operational risk framework, applied by Indian banks under RBI's capital adequacy norms, requires exactly this forward-looking lens: structured workshops where risk owners, business heads and independent reviewers stress-test plausible-but-severe events and convert judgement into numbers that regulators and boards can act on. This article walks through the full workflow, from why raw loss data fails on the tail, to workshop design, bias control, parameter conversion, and governance.
📊 Why Loss Data Alone Misses Tail Events
Every bank maintains an internal operational risk loss database, and it is genuinely useful for the high-frequency, low-severity end of the risk spectrum: cash counting errors, minor reconciliation breaks, small fraud. But that same database is structurally blind to the tail. A single-branch bank that has never suffered a major cyber breach has zero data points for that scenario, yet zero history is not the same as zero risk. The event may simply not have occurred yet.
New and evolving risk categories compound this problem. Outsourcing failures, technology outages, and third-party payment disruptions have short internal histories even at large banks, so the loss database under-represents them by design. Relying only on collection of loss data for capital and risk appetite decisions therefore systematically understates the tail, which is precisely why scenario analysis exists as a deliberate, forward-looking supplement rather than an optional extra.
🧭 Structuring the Scenario Workshop and Expert Elicitation
A credible scenario exercise starts with the panel, not the numbers. Workshops bring together the business line that owns the risk, the operational risk function, internal audit, and where relevant technology or legal specialists, so that no single voice sets the estimate unchallenged. An independent facilitator, usually from the risk function, runs the session so the discussion stays structured rather than becoming a defence of the status quo.
The scenario library itself is curated from multiple sources: the bank's own near-misses, findings from the operational risk and management framework, industry consortium loss data, and publicly reported events at peer banks. Each workshop walks through a fixed sequence: describe the scenario in plain business terms, agree the assumptions, elicit a frequency view, elicit a severity range, and sanity-check the result against the bank's balance sheet and past near-misses before it is recorded.
🎯 Anchoring and Other Biases in Scenario Estimation
Scenario analysis is judgement dressed as data, and judgement carries predictable biases. Anchoring is the most common: whichever number is spoken first in the room, often by the most senior participant, becomes the reference point everyone else adjusts around instead of forming an independent view. Availability bias pulls estimates toward whatever incident is freshest in memory, while motivated reasoning can push a business head to understate severity because a higher number implies a bigger capital charge against their unit.
The fix is procedural, not attitudinal. Collect individual, written estimates before any group discussion, then reconcile the spread openly. Use a three-point structure, best case, most likely, worst case, so participants are forced to think in ranges rather than a single anchored figure. Rotate who speaks first, and have the facilitator document the reasoning behind each number so a reviewer can trace how the estimate was reached, not just what it was. This connects directly to broader risk culture in banks, where tone from the top determines whether staff feel safe giving an honest, unfiltered severity view.
⚠️ Common Mistake: Letting the senior-most participant state a figure first. Once anchored, the rest of the room rarely moves far from that number, even when it understates the risk.
🔢 Converting Scenarios into Frequency and Severity Parameters
A workshop discussion is not yet a capital input. The qualitative scenario has to be converted into two numbers: frequency, expressed as how often the event is expected in, say, a twenty-year window, and severity, expressed as a best, likely and worst-case loss amount. These get fitted into the distributional assumptions used in a Loss Distribution Approach, typically a frequency distribution paired with a fat-tailed severity distribution, so the scenario's contribution sits alongside internal and external loss data rather than replacing it.
Where the bank already tracks leading indicators through its RCSA and Key Risk Indicators process, those indicators should inform the frequency view: a KRI trending toward its threshold is evidence the scenario is becoming more, not less, likely. Combining scenario output with historical data usually uses a credibility-weighting approach, giving more weight to actual experience where it exists and more weight to the scenario where the internal data is thin or absent.
💡 Exam Tip: If a question asks what two parameters a scenario is converted into for capital modelling, the answer is frequency and severity, not probability and impact, which is heat-map language rather than LDA language.
🏛️ Linking Scenario Outputs to Capital, Risk Appetite and Governance
Scenario output does not stop at the workshop room. It feeds the bank's operational risk capital calculation under ICAAP, supplements stress-testing narratives, and directly informs the thresholds written into the risk appetite statement, since a board cannot set a sensible tolerance limit without first seeing what a plausible severe event would cost. It also intersects with concentration exposure work: a scenario built around a single large borrower or sector failing sits close to the territory covered by concentration risk in bank lending, and both feed the same capital conversation from different angles.
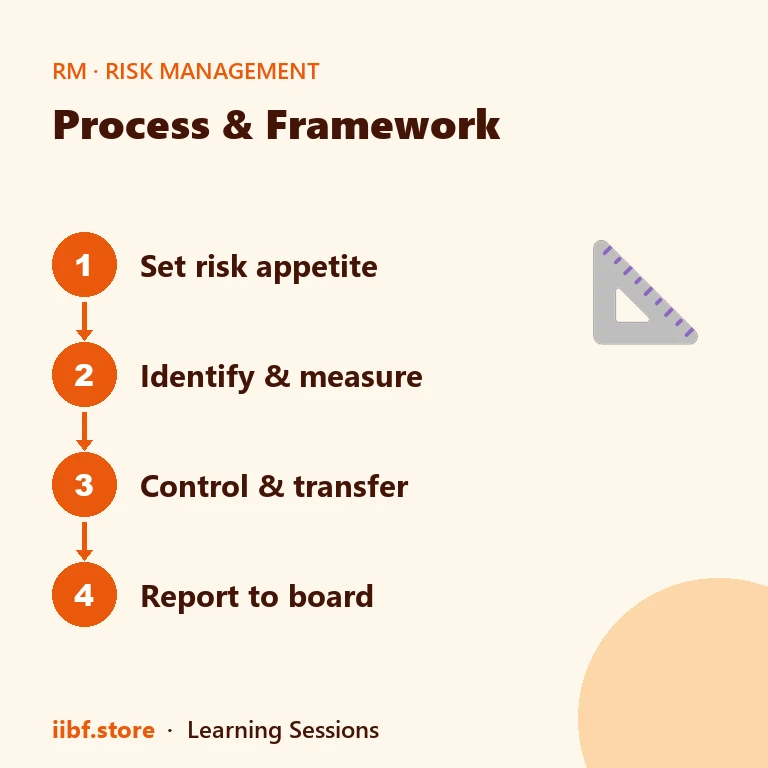
None of this is credible without governance. Sound practice keeps scenario generation with the first line, review and challenge with an independent second-line function, and periodic assurance with internal audit, mirroring the structure candidates study under an enterprise risk management framework. Estimates are refreshed on a set cycle, usually annually or after a material incident, with the risk committee and board formally approving material changes, and RBI's supervisory expectations on operational risk management reinforce this independent-challenge principle for regulated banks.
📌 Remember: A scenario estimate that is never revisited is stale by definition. Treat the refresh cycle, not just the initial workshop, as part of the control.
| Aspect | Historical Loss Data | Scenario Analysis |
|---|---|---|
| Primary source | Bank's own recorded loss events | Structured expert workshops plus external data |
| Captures rare tail events | ❌ Rare, thin coverage | ✅ Purpose-built for it |
| Time orientation | Backward-looking | Forward-looking |
| Key governance need | Data quality and completeness checks | Independent challenge and bias controls |
| Feeds the LDA capital model | Yes, frequency and severity | Yes, mainly the severity tail |
✅ Bringing It Together for the IIBF Exam
Scenario analysis in operational risk is not a side exercise for CAIIB Risk Management candidates; it is how the syllabus expects you to reason about events your loss database has never recorded. Remember the workflow as one continuous chain: a credible cross-functional workshop, bias controls that stop the loudest voice from setting the number, conversion into frequency and severity parameters that feed the capital model, and independent governance before the output ever touches the risk appetite statement or the board. For related coverage across the paper, browse the full Risk Management article archive, and when you are ready, attempt a full CAIIB Risk Management mock test to see how these concepts get examined.
🧠 Practice MCQs: Scenario Analysis in Operational Risk
Q1. What is the primary reason banks use scenario analysis in operational risk instead of relying only on internal loss data? (a) Internal loss data is too costly to collect (b) Internal loss data rarely contains the extreme, low-frequency tail events the bank has not yet experienced (c) Regulators do not accept internal loss data (d) Scenario analysis replaces the need for RCSA
Answer: (b) — Internal loss data reflects only events that have already occurred, so it structurally under-represents rare, severe tail events; scenario analysis is built to fill exactly that gap.
Q2. In a scenario analysis workshop, which technique is commonly used to reduce anchoring bias among participants? (a) Asking the most senior manager to state the estimate first (b) Collecting individual estimates before group discussion, then reconciling differences (c) Using only historical loss data instead of judgement (d) Skipping the facilitator role to save time
Answer: (b) — Independent, written estimates gathered before group discussion prevent the first number spoken from anchoring everyone else's judgement.
Q3. A scenario is typically converted into which two parameters for use in an operational risk capital model? (a) Probability and impact, as used on a risk heat map (b) Frequency and severity (c) Duration and liquidity (d) Credit rating and exposure at default
Answer: (b) — Frequency and severity are the two parameters fitted into the Loss Distribution Approach; probability-impact scoring belongs to qualitative heat-map tools, not capital modelling.
Q4. Scenario analysis outputs primarily feed into which two elements of a bank's risk framework? (a) Only the marketing budget (b) Operational risk capital under ICAAP and the thresholds in the risk appetite statement (c) Only the HR training calendar (d) Only the branch expansion plan
Answer: (b) — Scenario severity estimates supplement the capital calculation and give the board a factual basis for setting risk appetite thresholds.
Q5. Which of the following best describes sound governance of scenario analysis outputs? (a) The business line that owns the risk finalises the estimate alone (b) Estimates are used once and never revisited (c) An independent function challenges assumptions, and outputs are refreshed periodically with risk committee or board oversight (d) Only the CFO signs off without risk function involvement
Answer: (c) — Independent second-line challenge plus a defined refresh cycle and formal committee or board approval is what separates a governed scenario process from an unchecked one.
Want chapter-wise mock tests with 100+ MCQs? Start practising free →
What is scenario analysis in operational risk?
It is a structured process using expert workshops to estimate the frequency and severity of low-probability, high-impact operational risk events that internal loss data does not adequately cover.
Why can't internal loss data alone capture tail risk?
A bank's own loss history is finite and reflects only events that have already occurred; genuinely rare events such as major fraud or a prolonged technology outage may have no internal data points despite being entirely plausible.
How is anchoring bias controlled in scenario workshops?
By collecting independent, individual estimates before group discussion, using a neutral facilitator, and documenting the reasoning behind each frequency and severity range so it can be reviewed later.
How do scenario outputs affect a bank's capital requirement?
Scenario-derived severity estimates supplement the loss distribution approach used for operational risk capital under ICAAP, and they also inform the loss thresholds written into the risk appetite statement.
Practice this topic
Take a free mock test, download chapter PDFs, or watch a video class — all included on iibf.store.
Keep reading