Key Risk Indicators in Banking: A Practical RFS Guide
Every bank collects thousands of numbers every day, but only a handful of them warn you before a small problem turns into a large loss. Key risk indicators in banking are exactly that: a short list of measurable signals that flash amber or red before exposure gets out of hand. For anyone preparing for the Risk in Financial Services (RFS) paper, this is not a side topic — examiners expect you to explain how the framework works, not just define the term.
This article walks through how key risk indicators in banking are built, tracked, and escalated, and how they connect to loss data, stress testing, and board-level oversight. By the end you will be able to answer both the theory questions and the case-study style questions on this topic.
📊 What Are Key Risk Indicators in Banking?
A key risk indicator, or KRI, is a metric that gives an early signal that a risk is rising toward an unacceptable level. Unlike a Key Performance Indicator (KPI), which tells you how well the business is doing, a KRI tells you how much danger is building up. A rising number of failed transactions, a jump in staff attrition in a critical unit, or a spike in system downtime are all classic examples.
Banks do not pick KRIs at random. Each one is mapped to a specific risk in the bank's risk taxonomy — credit, operational, liquidity, compliance, or technology — and tied to a business process that the risk actually affects. This mapping is explained in detail in the risk management chapter, which is worth revisiting before you attempt case studies on this topic.
💡 Exam Tip: If a question asks you to tell a KRI apart from a KPI, remember: KRI looks forward at danger, KPI looks back at performance. That one line answers most MCQs on this distinction.
🏦 Building a Key Risk Indicator Framework
A working key risk indicator framework has three moving parts: the indicator itself, a threshold, and an escalation path. Thresholds are usually set as green, amber, and red bands. Green means the risk is within normal range. Amber means it needs watching. Red means it has crossed the trigger level and someone senior must act immediately.
Where do the threshold numbers come from? Mostly from history. Banks study their own past losses to decide what "normal" looks like, and this is exactly why loss data matters so much. The collection of loss data chapter covers how operational loss events are recorded, categorised, and fed back into these thresholds so they stay realistic rather than arbitrary.
A good framework also assigns an owner to every indicator. Nobody should be able to say "that number is nobody's job" when it turns red. Ownership, not just measurement, is what regulators check during a supervisory review.
🚨 KRIs and the Three Lines of Defence
Key risk indicators do not sit only with the risk department. They are tracked across the three lines of defence: the business unit that owns the risk day to day, the risk management function that sets standards and challenges the numbers, and internal audit that checks whether the whole system is working as designed.
This layered structure exists because banking is a uniquely regulated business, and a single missed signal can affect depositors far beyond one branch. The why do banks need regulation chapter explains this public-interest angle, which is the reason KRI reporting eventually reaches the board risk committee, not just middle management.
⚠️ Common Mistake: Students often assume KRIs are only an operational risk tool. In practice, banks track KRIs for credit concentration, liquidity buffers, and compliance breaches too — not operational risk alone.
📈 Common Key Risk Indicators Banks Track
The exact list varies by bank, but most frameworks cover the same broad categories. The table below gives a quick, exam-friendly snapshot of common indicators, the risk they warn about, and whether they usually get board-level visibility.
| Risk Category | Example KRI | Typical Trigger | Board Visibility |
|---|---|---|---|
| Operational | Number of failed/delayed transactions | Sustained rise over 3 months | ✅ |
| Technology | System downtime (hours per quarter) | Breach of uptime SLA | ✅ |
| Credit | Growth rate in a single-sector exposure | Approach to internal concentration limit | ✅ |
| Liquidity | Fall in liquidity coverage buffer | Drop toward regulatory minimum | ✅ |
| People | Staff attrition in control functions | Above historical average | ❌ |
| Compliance | Number of regulatory breaches reported | Any repeat breach | ✅ |
Notice that most of these reach the board, while a few, like routine staffing metrics, stay at management level unless they turn red. That split is itself a common exam point: not every KRI needs board escalation, only the ones tied to material risk.
🔗 KRIs, Stress Testing and Regulatory Reporting
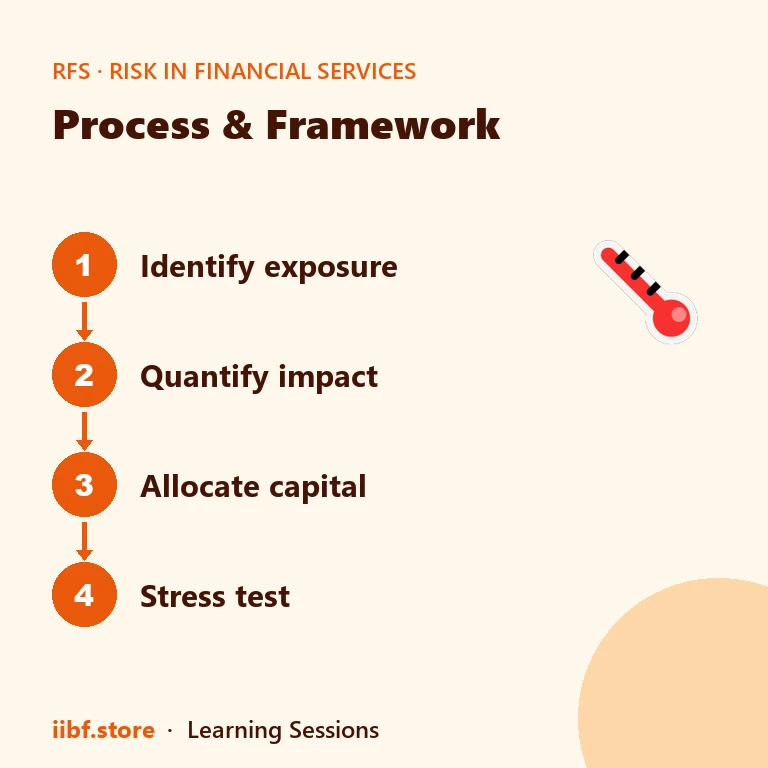
Key risk indicators do not work in isolation. They feed into, and get validated by, stress testing. If a stress scenario shows that a liquidity KRI would breach its red threshold under a mild shock, the bank knows its trigger level is set too loosely. The stress testing and PCA framework chapter shows how this feedback loop works, including how weak indicators can push a bank toward Prompt Corrective Action.
Supervisors also expect KRI data to support the bank's broader oversight process. This connects directly to risk based supervision, where the regulator uses a bank's own risk indicators, alongside its own assessment, to decide how closely to watch a particular institution. For the underlying regulatory expectations on risk monitoring and reporting, the Reserve Bank of India publishes detailed supervisory guidance that is worth skimming before your exam.
📌 Remember: A KRI that never turns red is not necessarily good news — it may mean the threshold was set too high to ever trigger. Reviewing thresholds periodically is part of the framework, not an optional extra.
🧭 KRIs vs Risk Register vs Risk Appetite
Students often mix up three related but distinct tools. A risk register lists every identified risk a bank faces, whether or not it is currently being measured. A key risk indicator is a live metric tracking one specific risk from that register. Risk appetite is the boundary the board has agreed the bank will not cross.
Put simply: the register says what could go wrong, the KRI says how close it currently is to going wrong, and the appetite statement says how much wrong the bank is willing to tolerate. The risk appetite framework article covers that boundary-setting process in depth, and is a natural companion read to this one.
Large exposure limits and capital buffers work the same way in practice. A bank tracking KRIs on sector concentration is really watching its position against the large exposures framework, while a systemic bank also watches indicators tied to its D-SIB capital surcharge obligations. Seeing these frameworks as connected, rather than separate silos, is what turns a memorised definition into exam-ready understanding.
🧠 Practice MCQs: Key Risk Indicators in Banking
Q1. What is the primary purpose of key risk indicators in banking? (a) To measure quarterly profit (b) To provide an early warning signal of rising risk exposure (c) To calculate the regulatory capital adequacy ratio (d) To rate a borrower's creditworthiness
Answer: (b) — KRIs exist to flag rising risk before it crosses into loss, not to measure profit or creditworthiness directly.
Q2. In a typical KRI dashboard, which colour signals that a risk has crossed its trigger level and needs immediate escalation? (a) Green (b) Blue (c) Amber (d) Red
Answer: (d) — Red marks a breach of the pre-set threshold requiring senior-level action; amber only signals a risk to watch.
Q3. Which statement best distinguishes a KRI from a KPI? (a) KRIs measure business output, KPIs measure risk (b) KRIs are forward-looking risk signals, KPIs track business performance (c) KRIs are used only by insurance companies (d) KPIs are set only by the regulator
Answer: (b) — KRIs warn about rising danger; KPIs report how well a business objective is being met.
Q4. Collection of operational loss data primarily supports which activity? (a) Setting and validating KRI thresholds (b) Fixing the bank's lending rate (c) Deciding shareholder dividends (d) Approving new branch licences
Answer: (a) — Historical loss data tells a bank what a realistic threshold looks like for each indicator.
Q5. Under the three lines of defence model, who monitors KRIs on a day-to-day basis? (a) External auditors (b) The business or risk-owning unit (first line) (c) The board of directors alone (d) The customer grievance cell
Answer: (b) — The first line owns the risk and the indicator daily; risk management and audit provide the second and third lines of challenge.
Want chapter-wise mock tests with 100+ MCQs? Start practising free →
❓ Frequently Asked Questions
What is a key risk indicator in banking?
It is a measurable metric, such as system downtime or failed transaction counts, used to warn a bank early that a specific risk is approaching an unacceptable level.
How is a KRI different from a risk appetite statement?
A KRI is a live measurement of one risk, while risk appetite is the board-approved boundary for how much of that risk the bank is willing to accept overall.
Who sets KRI thresholds in a bank?
Thresholds are usually proposed by the risk management function using historical loss data, then approved by the relevant risk committee or the board.
How often should KRIs be reviewed?
Most banks review thresholds at least annually, or sooner if stress testing or a loss event shows the existing trigger level is unrealistic.
Key risk indicators in banking turn a wall of daily data into a small, actionable set of early warnings, and that is exactly why RFS examiners keep coming back to this topic in different forms. Revise the framework alongside loss data collection and stress testing so you can connect the dots in a case study, not just recall a definition. For more structured practice on this and related topics, explore our CAIIB course or browse the full risk in financial services archive.
Prefer revising from a printed book?
Chapter-wise books with MCQs after every chapter — minimal pages, complete coverage, delivered anywhere in India. Every book has a free sample to read first.























Practice this topic
Take a free mock test, download chapter PDFs, or watch a video class — all included on iibf.store.
Keep reading