Profitability Ratios for JAIIB AFM: Formulas, Examples & Tricks
Profitability Ratios in 5 Minutes — JAIIB AFM Quick Revision · Watch on YouTube
Is a company actually making money, or just making sales? Profitability ratios answer that question in a single number, and JAIIB AFM leans on them heavily in the ratio-analysis block. These profitability ratios convert a bulky profit-and-loss statement into crisp percentages you can compare year on year or firm against firm. In the next five minutes we cover the four profitability ratios examiners test most — gross profit margin, net profit margin, operating profit ratio and return on capital employed — each with its formula and a worked example.
What Profitability Ratios Measure
Profitability ratios express profit as a proportion of another figure — sales, capital, or assets — so that scale is stripped away. A ₹10 crore profit sounds impressive until you learn it came from ₹500 crore of capital. By standardising, profitability ratios let a JAIIB candidate judge efficiency, not just size, which is precisely what AFM numericals reward.
Margin-Based Profitability Ratios
Three margin ratios sit at the core:
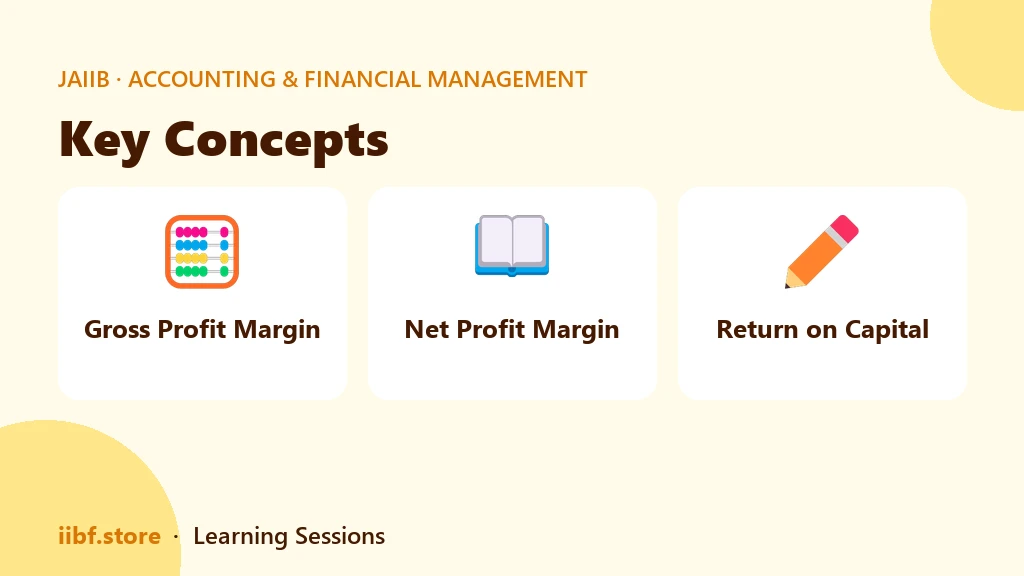
- Gross Profit Margin = (Gross Profit / Net Sales) × 100 — shows production and pricing efficiency.
- Operating Profit Ratio = (Operating Profit / Net Sales) × 100 — profit after operating expenses but before interest and tax.
- Net Profit Margin = (Net Profit / Net Sales) × 100 — the bottom-line percentage after everything.
The gap between gross and net margin reveals how much overhead, interest and tax eat into profit — a classic AFM MCQ.
Return-Based Profitability Ratios
Return ratios link profit to the money invested:
| Ratio | Formula | What It Shows |
|---|---|---|
| ROCE | EBIT / Capital Employed × 100 | Efficiency of total capital |
| ROE | Net Profit / Shareholders' Funds × 100 | Return to owners |
| ROA | Net Profit / Total Assets × 100 | Asset efficiency |
Worked Example
A firm has Net Sales ₹20 lakh, Gross Profit ₹6 lakh, Net Profit ₹2 lakh and Capital Employed ₹10 lakh (EBIT ₹3 lakh). Then Gross Profit Margin = (6 / 20) × 100 = 30%, Net Profit Margin = (2 / 20) × 100 = 10%, and ROCE = (3 / 10) × 100 = 30%. Three profitability ratios from one small table — that is the calculation speed AFM demands.
Drill these formulas in a timed JAIIB mock test, schedule daily revision on the study planner, and cover the full syllabus in the JAIIB course. For the official AFM syllabus, check the IIBF website. More quick-revision reels are on our blog.
Profitability Ratios vs Other Ratio Families
AFM groups ratios into four families: liquidity (current ratio, quick ratio), solvency (debt-equity, interest coverage), activity or turnover (stock turnover, debtors turnover), and profitability. Profitability ratios stand apart because they measure the final outcome — whether all the liquidity, leverage and efficiency actually converted into profit. A firm can have a healthy current ratio and still be unprofitable, which is why examiners often pair a profitability ratio with a liquidity ratio and ask which tells you more about long-run survival. Knowing the boundaries between the families prevents you from applying the wrong formula under time pressure.
Interpreting Ratio Trends
A single year's profitability ratios mean little; the insight comes from the trend. A rising gross margin with a falling net margin signals ballooning overheads, interest or tax. A steady net margin but a falling ROCE hints that the firm is deploying more capital without extra return. AFM questions sometimes give two years of figures and ask you to diagnose the story — so practise reading the direction of change, not just the number. This is also where profitability ratios connect to real credit appraisal: a lender watches these trends to judge repayment capacity.
Profitability Ratios in the Banking Sector
Banks have their own profitability ratios worth knowing. Net Interest Margin (NIM) is interest income minus interest expense, divided by average earning assets — the banking equivalent of a core operating margin. Return on Assets (ROA) and Return on Equity (ROE) apply just as they do for a company, and the cost-to-income ratio measures operating efficiency. Because JAIIB is a banking exam, a question may switch from a manufacturing firm to a bank and expect you to pick NIM rather than gross margin. Recognising the context is half the battle.
Common Numerical Traps
Three mistakes cost marks most often. First, mixing up "net sales" with "total revenue" — always use net sales as the base for margins. Second, using net profit instead of EBIT when computing ROCE. Third, forgetting to multiply by 100 to express the profitability ratios as a percentage. Slow down on the base and the multiplier, and these easy marks stay yours. Reinforce the formulas with a timed drill on the mock-test engine so the numbers become second nature before exam day.
Linking Profitability Ratios to the DuPont View
A powerful way to remember how the profitability ratios connect is the DuPont decomposition, which splits Return on Equity into three levers: net profit margin (profitability), asset turnover (efficiency) and the equity multiplier (leverage). Multiply them and you get ROE. The lesson is that a firm can lift its return by earning fatter margins, by using its assets harder, or by adding leverage — and each route carries different risk. AFM does not always name DuPont explicitly, but questions that ask why two firms with the same ROE differ in quality are really testing this idea. Seeing profitability ratios as interconnected levers, rather than isolated formulas, is what separates a rank-holder from an average scorer.
What are the main profitability ratios in JAIIB AFM?
Gross profit margin, operating profit ratio, net profit margin, ROCE, ROE and ROA. Margins and ROCE appear most often.
What is the formula for net profit margin?
Net Profit Margin = (Net Profit / Net Sales) × 100. It shows the percentage of every rupee of sales that becomes bottom-line profit.
How is ROCE different from ROE?
ROCE uses EBIT over total capital employed; ROE uses net profit over shareholders' funds only. ROCE judges overall efficiency, ROE judges owner returns.
Why do profitability ratios use percentages?
Percentages remove the effect of scale, so profitability ratios let you compare firms of very different sizes on a like-for-like basis.
Prefer revising from a printed book?
Chapter-wise books with MCQs after every chapter — minimal pages, complete coverage, delivered anywhere in India. Every book has a free sample to read first.
128 pages · 524 MCQs
Learning Sessions · Ashish Sir
131 pages · 672 MCQs
Learning Sessions · Ashish Sir
221 pages · 831 MCQs
Learning Sessions · Ashish Sir
107 pages · 445 MCQs
Learning Sessions · Ashish Sir
148 pages · 478 MCQs
Learning Sessions · Ashish Sir
151 pages · 465 MCQs
Learning Sessions · Ashish Sir
148 pages · 375 MCQs
Learning Sessions · Ashish Sir
216 pages · 895 MCQs
Learning Sessions · Ashish Sir
109 pages · 300 MCQs
Learning Sessions · Ashish Sir
104 pages · 360 MCQs
Learning Sessions · Ashish Sir
82 pages · 297 MCQs
Learning Sessions · Ashish Sir
151 pages · 600 MCQs
Learning Sessions · Ashish Sir
98 pages · 282 MCQs
Learning Sessions · Ashish Sir
132 pages · 225 MCQs
Learning Sessions · Ashish Sir
188 pages · 435 MCQs
Learning Sessions · Ashish Sir
117 pages · 236 MCQs
Learning Sessions · Ashish Sir
Learning Sessions · Ashish Sir
118 pages · 299 MCQs
Learning Sessions · Ashish Sir
Learning Sessions · Ashish Sir
Learning Sessions · Ashish Sir
Learning Sessions · Ashish Sir
115 pages · 255 MCQs
Learning Sessions · Ashish Sir
Learning Sessions · Ashish Sir
334 pages · 936 MCQs
Learning Sessions · Ashish Sir
Learning Sessions · Ashish Sir
115 pages · 344 MCQs
Learning Sessions · Ashish Sir
107 pages · 240 MCQs
Learning Sessions · Ashish Sir
90 pages · 150 MCQs
Learning Sessions · Ashish Sir
Learning Sessions · Ashish Sir
Quick quiz on this topic
5 exam-style questions from our free test bank — check yourself before you move on.
Practice this topic
Take a free mock test, download chapter PDFs, or watch a video class — all included on iibf.store.