Measures of Dispersion & Range: CAIIB ABM Statistics Simplified
Dispersion & Range in Statistics — CAIIB ABM Quick Revision · Watch on YouTube
An average alone can lie. Two branches can report the same mean deposit balance yet behave completely differently — and that gap is exactly what measures of dispersion reveal. In CAIIB ABM statistics, dispersion tells you how spread out a data set is around its centre, and the simplest of these measures of dispersion is the range. This revision walks through range, quartile deviation and standard deviation with clean formulas and a worked example, so the numbers stop feeling abstract and start scoring marks.
Why Measures of Dispersion Matter
Central-tendency values — mean, median, mode — tell you where a data set clusters. But they say nothing about consistency. Two loan portfolios can share a mean interest rate of 10% while one ranges from 9-11% and the other from 4-16%. The measures of dispersion quantify that scatter, and in banking they underpin risk metrics like volatility and value-at-risk. That is why ABM devotes a full block of MCQs to them.
Range: The Simplest Measure
The range is the easiest of all measures of dispersion: simply the difference between the largest and smallest values.
Range = Largest value (L) − Smallest value (S)
Its cousin, the coefficient of range, expresses this relative to the total spread: (L − S) / (L + S). The range is quick but sensitive to outliers — a single extreme value distorts it, which is a favourite exam trap.
Quartile Deviation and Standard Deviation
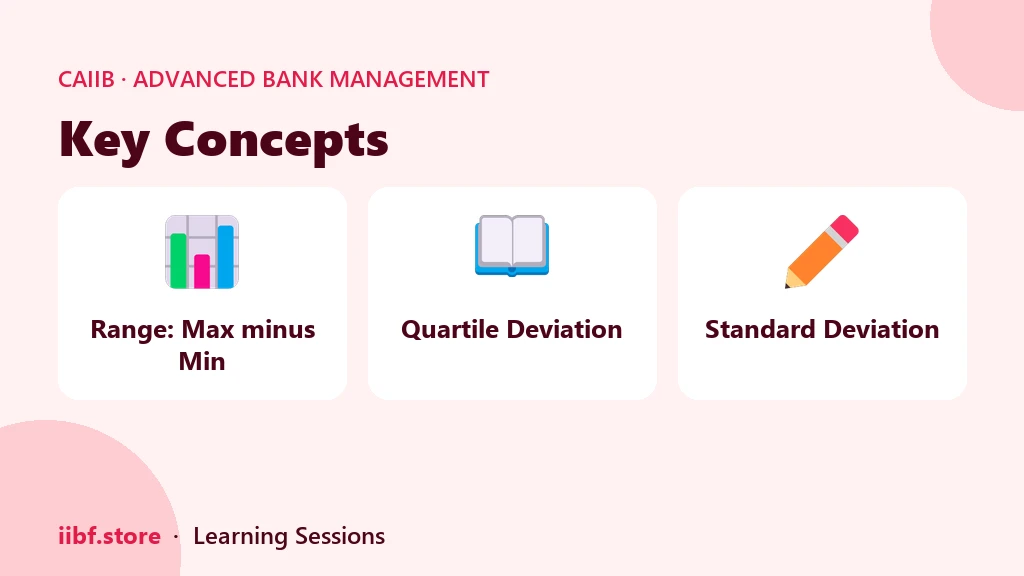
To reduce the outlier problem, statisticians use quartile deviation (semi-interquartile range): Q.D. = (Q3 − Q1) / 2. It ignores the extreme 25% at each end. The most powerful of the measures of dispersion, however, is the standard deviation (σ) — the square root of the mean of squared deviations from the mean. Unlike the range, it uses every observation.
| Measure | Formula | Uses all data? |
|---|---|---|
| Range | L − S | No |
| Quartile Deviation | (Q3 − Q1) / 2 | No |
| Mean Deviation | Σ|x − x̄| / n | Yes |
| Standard Deviation | √(Σ(x − x̄)² / n) | Yes |
Worked Example
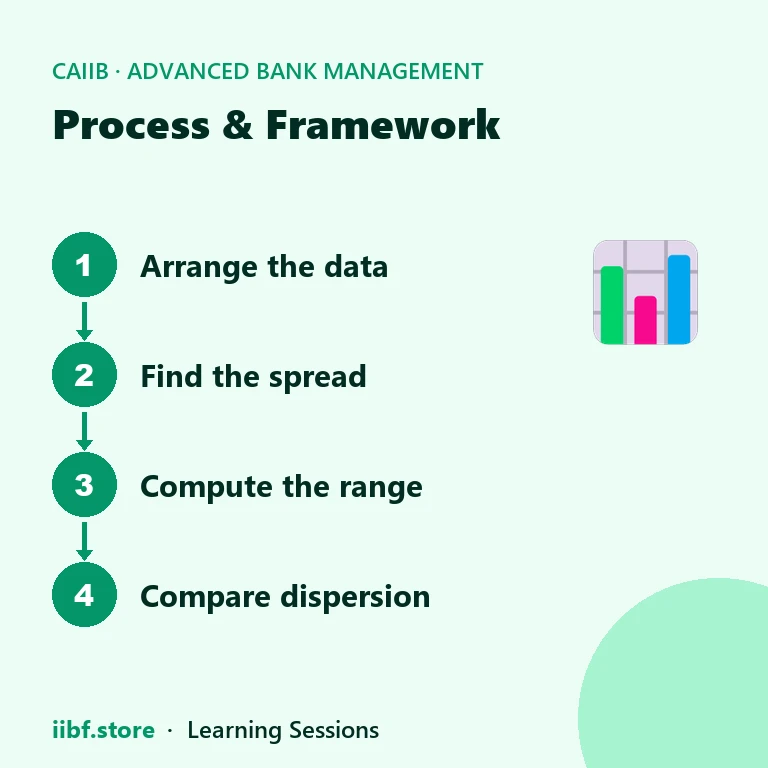
Take the data set: 12, 18, 25, 30, 40. The largest value is 40 and the smallest is 12, so Range = 40 − 12 = 28. The coefficient of range = (40 − 12) / (40 + 12) = 28 / 52 = 0.538. In one line you have applied two measures of dispersion — exactly the speed the exam rewards. Practise the standard-deviation version in a timed mock test and lock in the formula through our concept match game.
The complete statistics module sits inside the CAIIB ABM course, part of the wider CAIIB programme. For the official syllabus weightage, confirm on the IIBF website.
Absolute vs Relative Measures of Dispersion
The measures of dispersion split into two families. Absolute measures — range, quartile deviation, mean deviation and standard deviation — are expressed in the same units as the data, so a standard deviation of ₹12 lakh is in rupees. Relative measures — the coefficient of range, coefficient of quartile deviation, coefficient of mean deviation and the coefficient of variation — are pure numbers or percentages, which lets you compare data sets measured in different units or of very different sizes. The coefficient of variation (CV = σ / mean × 100) is the star of this family: it answers "which portfolio is more consistent?" regardless of scale, and CAIIB loves to ask exactly that.
Standard Deviation Step by Step
Because standard deviation is the most tested of the measures of dispersion, walk through it once slowly. First, compute the mean of the data set. Second, subtract the mean from each value to get the deviations. Third, square each deviation — this removes the sign so positives and negatives do not cancel. Fourth, average the squared deviations to get the variance. Fifth, take the square root of the variance to return to the original units — that is the standard deviation. The only common trap is forgetting the final square root, which leaves you with variance instead. Practise this sequence until it is muscle memory.
Where Dispersion Shows Up in Banking
These measures of dispersion are not academic. A treasury desk uses standard deviation of daily returns as the core input to Value-at-Risk. A credit team compares the coefficient of variation of two borrowers' cash flows to judge which is the steadier earner. A branch manager watches the range of month-end balances to spot volatility in deposits. In every case, dispersion turns a single average into a picture of risk — which is why the topic bridges the statistics block and the risk-management block of CAIIB.
Exam Strategy for Statistics
Statistics questions reward speed and accuracy, not lengthy reasoning. Keep the four absolute formulas and their relative counterparts on a single revision card, memorise which measures ignore extreme values and which use all data, and practise at least two full numericals a day. When a question gives you a small data set, identify the measure being asked for, apply the formula directly, and move on — over-thinking is the biggest time-sink here.
Grouped Data and the Range
Real banking data usually arrives grouped into class intervals rather than as neat single values, and the measures of dispersion adapt accordingly. For a frequency distribution, the range is taken as the upper boundary of the highest class minus the lower boundary of the lowest class. Quartile deviation and standard deviation each have grouped-data versions that weight every deviation by its frequency. The concept does not change — you are still measuring spread — but the arithmetic carries a frequency column. Expect at least one grouped-data question, and read the class boundaries carefully, because mixing up class limits with class boundaries is the classic slip that turns an easy mark into a wrong answer.
What are the main measures of dispersion in CAIIB ABM?
Range, quartile deviation, mean deviation and standard deviation. Range and standard deviation are the two most frequently tested.
How do you calculate range?
Range = Largest value − Smallest value. The coefficient of range is (L − S) / (L + S), used to compare data sets of different scales.
Which measure of dispersion is affected most by outliers?
The range, because it depends only on the two extreme values. Quartile deviation and standard deviation are more robust.
Why is standard deviation preferred?
Because it is the only common measure of dispersion that uses every observation and feeds directly into risk and volatility calculations.
Prefer revising from a printed book?
Chapter-wise books with MCQs after every chapter — minimal pages, complete coverage, delivered anywhere in India. Every book has a free sample to read first.
148 pages · 478 MCQs
Learning Sessions · Ashish Sir
151 pages · 465 MCQs
Learning Sessions · Ashish Sir
148 pages · 375 MCQs
Learning Sessions · Ashish Sir
216 pages · 895 MCQs
Learning Sessions · Ashish Sir
109 pages · 300 MCQs
Learning Sessions · Ashish Sir
104 pages · 360 MCQs
Learning Sessions · Ashish Sir
82 pages · 297 MCQs
Learning Sessions · Ashish Sir
151 pages · 600 MCQs
Learning Sessions · Ashish Sir
98 pages · 282 MCQs
Learning Sessions · Ashish Sir
131 pages · 672 MCQs
Learning Sessions · Ashish Sir
221 pages · 831 MCQs
Learning Sessions · Ashish Sir
128 pages · 524 MCQs
Learning Sessions · Ashish Sir
107 pages · 445 MCQs
Learning Sessions · Ashish Sir
132 pages · 225 MCQs
Learning Sessions · Ashish Sir
188 pages · 435 MCQs
Learning Sessions · Ashish Sir
117 pages · 236 MCQs
Learning Sessions · Ashish Sir
Learning Sessions · Ashish Sir
118 pages · 299 MCQs
Learning Sessions · Ashish Sir
Learning Sessions · Ashish Sir
Learning Sessions · Ashish Sir
Learning Sessions · Ashish Sir
115 pages · 255 MCQs
Learning Sessions · Ashish Sir
Learning Sessions · Ashish Sir
334 pages · 936 MCQs
Learning Sessions · Ashish Sir
Learning Sessions · Ashish Sir
115 pages · 344 MCQs
Learning Sessions · Ashish Sir
107 pages · 240 MCQs
Learning Sessions · Ashish Sir
90 pages · 150 MCQs
Learning Sessions · Ashish Sir
Learning Sessions · Ashish Sir
Quick quiz on this topic
5 exam-style questions from our free test bank — check yourself before you move on.
Practice this topic
Take a free mock test, download chapter PDFs, or watch a video class — all included on iibf.store.